

Grey Relational Analysis
Grey relational analysis (GRA) or Grey analysis is a technique by measure the degree of estimate among sequences relating to the grey relational grade (GRG).
It consist of four steps where normalizing of the input data is required, calculation of deviation sequence, estimation of grey relational coefficient and final the grey relational grade (GRG) will be estimated based on the weights. The weights can be calculated by using AHP method and CRITIC method also.
The different steps used in the GRA method will be discussed here. The video tutorials and the solved case study spreadsheets will be also shared.
Steps in Grey relational analysis
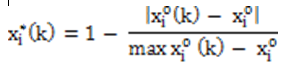
Step 1 Normalizing the data - here the data consists of different dimensions, the target here the data need to normalized in between 0 to 1.
For Higher the better


Step 2 Determining the deviation sequence by using the formula below
Step 3 Estimating the Grey relational Coefficient (GRC) by using the formula.

Step 4 the final step is grey relational grade (GRG) calculated by using this formula

Case study tutorial - step by step procedure for grey relational analysis - Milling of Aluminum Hybrid Metal matrix Composites
Download the Excel file, which is solved in the video


Sir i need demo for Gray analysis by mini tab
ReplyDeleteWe cant do in Minitab, as it doesnot have the option to do it.
ReplyDelete